
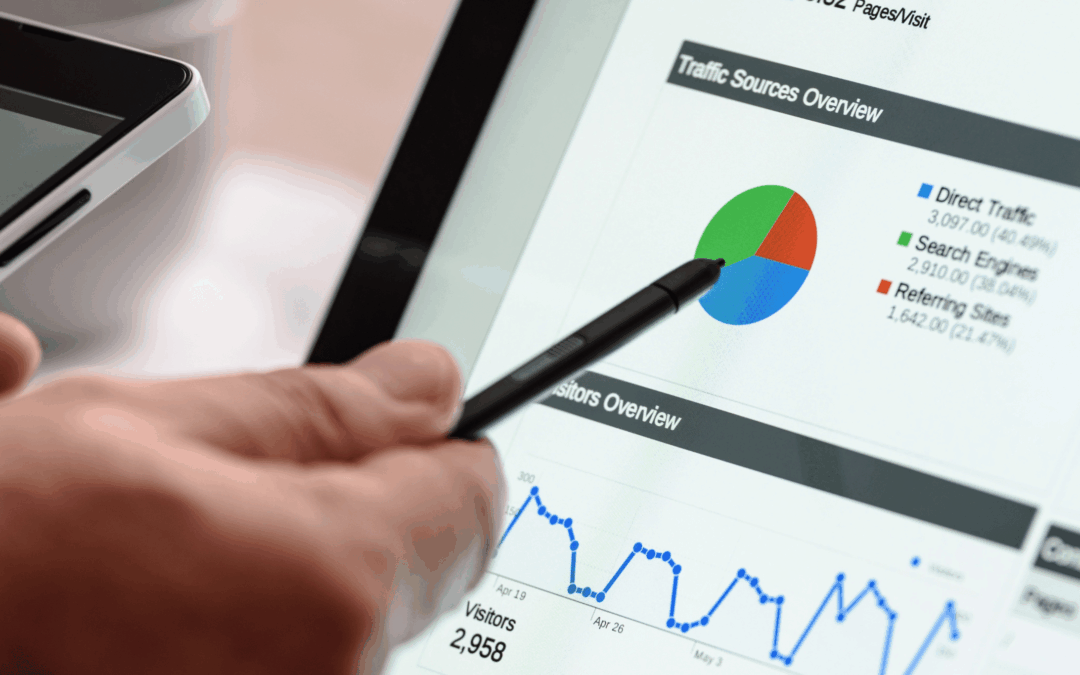
Our related post, Not All Website Traffic Is Useful, explains why a rise in visits does not always mean more business. Rather than focusing solely on total traffic, evaluate your website’s impact on business growth by following visitor journeys. Focus on key touchpoints: how visitors discover your site, the content they engage with, points of drop-off, and whether they ultimately convert through inquiries, bookings, or sales.
Start with your website’s goal: sell a product, book an appointment, or generate inquires. Then track these measures that show whether visitors get there.
How Many Visitors Take Action?
Conversion rate is the share of visitors who complete an action you choose to track. What counts as that action depends on your business: a purchase, quote request, booked appointment, phone call, or email signup. Compare the same action across your different marketing channels including paid search ads, organic search, email marketing, social media, influencer marketing, and affiliate links.
Look at the number and value of those actions, too. When comparing the same action, a 10% rate from 20 visits means two completed actions; a 4% rate from 500 visits means 20. The higher rate is not automatically better. For inquiries, check how many become customers; for purchases, compare the revenue each source brings in. Use consistent names for ads and promotions so you can tell where visitors came from.
Which Pages Move Visitors Forward?
See where visitors land and what they do next. Do they click to service details, pricing, reviews, or contact? If they leave without clicking, clarify the offer and next step. If they open the contact form but do not send it, simplify the form. A click shows interest but does not always result in a conversion.
Do Inquiries Become Customers?
Count inquiries from people who need what you sell separately from all form submissions. Track how many become appointments, projects, or customers, and compare sales by where people found you. The cost to gain a customer is what you spend on sales and marketing to win one.
A low cost per inquiry may not help if few of those people become customers. Some customers take weeks to decide, so follow each inquiry until they decide.
Where Do Visitors Stop?
Every sale or inquiry has steps. A service customer might read a service page, choose “contact us”, and submit a form. An online shopper might view a product, add it to a cart, and pay. Check how many people reach each step when reviewing your analytics.
If many start but few finish, look for confusing wording, long forms, surprise costs, or problems on phones. The numbers point to the step to review; the page can help explain why people leave.
How Do People Use Your Content?
Check how far visitors scroll on longer pages, whether they start or finish videos, and which links they click. This shows what catches attention.
These actions are clues, not business results. Check whether those visitors go on to call, ask for a quote, buy, or visit your contact page.
Which Traffic Channels Bring Sales
For online stores, compare sales with visits, average spend per order, and repeat purchases. For service businesses, compare bookings, new customers, and sales by source. These measures show which sources bring in money, not just visits or inquiries.
Mobile vs. Desktop Behavior
Compare results for visitors on phones and computers. If people start filling out a form, but do not finish, it’s a good indication that there could be something wrong with that webpage or form. Check whether the page loads quickly, buttons are easy to tap, and forms are simple to complete using your mobile device. Analyzing overall website performance metrics alone can mask underlying issues specific to mobile devices.
Monthly Metrics To Review
Start with four simple measures:
- Inquiries from potential customers, purchases, and sales
- Results and cost to gain a customer by source
- Pages and steps where visitors stop
- Results from phones and computers, plus scroll or video activity on key pages
Compare similar time periods and keep seasonal changes in mind. If visits rise but inquiries or sales do not, check which sources and pages bring visitors. If people start a form but do not finish it, make it simpler. Use each measure to choose one improvement.
Need help putting these insights to work? Ink + Insight can help improve your website, help the right people find you online, and keep your business connected through email marketing. Get in touch with us today to learn more.
Written by Nicole DeiCicchi